
Give Your Team One Place to See Workload, Tickets & Time
 Google Partner
Shopify Partner
20+ Years of Experience
Google Partner
Shopify Partner
20+ Years of Experience
Google Partner
Shopify Partner
20+ Years of Experience
Google Partner
Shopify Partner
20+ Years of Experience
Managing day-to-day operations often means checking several disconnected sources—one place for tickets, another for logged hours, another for workload planning, and spreadsheets to tie it all together. That makes it harder to see what’s actually happening across a team at any given time.
Arissa’s Priority Tool brings ticket management, workload visibility, and time tracking into one platform—giving teams a clearer, more current view of what’s being worked on, who’s working on it, and where time is actually being spent.
Operational Visibility Shouldn’t Require Checking Five Different Systems
A single day of operational work touches many moving pieces: tickets coming in, work being assigned, hours being logged, deadlines approaching, and reports that need to reflect it all accurately.
Priority Tool
When ticket systems, time-tracking tools, and reporting live separately, teams lose time reconciling information instead of acting on it—and it becomes harder to know who’s overloaded, what’s falling behind, or where a project’s time is actually going.
Arissa’s Priority Tool connects ticket activity, employee workload, and time tracking into a single operational platform, so teams can manage day-to-day work from one place instead of switching between systems.
What Arissa’s Priority Tool Provides
Workload Dashboard
See assigned weekly and monthly task hours for each employee, and compare workload across the team.
Ticket Management
Create, edit, update, and track tickets, with ticket data synced automatically from Gmail.
Operational Reporting
Get an up-to-date view of inbox volume, lead counts, and ticket activity across teams and individuals.
Time & Attendance Tracking
Track logged working hours through Punch In/Punch Out data, summarized daily, weekly, and monthly.
Estimate vs. Actual Comparison
Compare estimated effort against actual hours logged to understand where tasks ran over or under estimate.
Project-Level Reporting
See how working hours are distributed across projects to understand where team capacity is being spent.
See Workload Before It Becomes a Bottleneck
Without a way to see it at a glance, it’s hard to understand who’s carrying how much work.
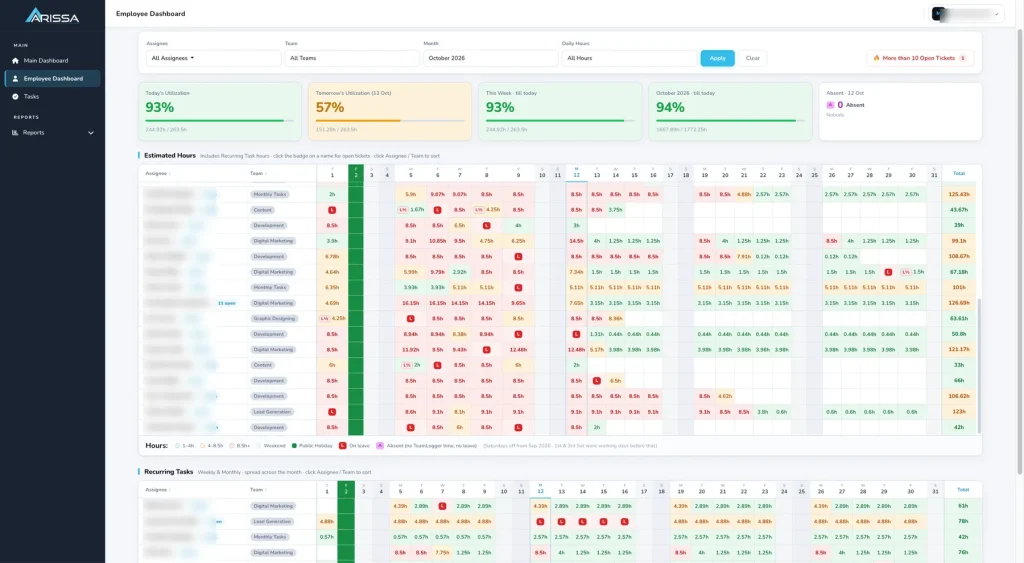
The Priority Tool’s dashboard shows the hours assigned to each employee for weekly and monthly tasks, with the ability to switch between months to see how workload has shifted over time.
Workload by Employee
See hours assigned per employee for the current period.
Month-to-Month Comparison
Switch between months to review how workload has changed.
Team Comparison
Compare employees side by side to identify who has a heavier workload and who has available capacity.
Ticket Management
Keep Ticket Information Current Automatically
Tickets are the operational core of day-to-day work, and they’re only useful if the information stays current.
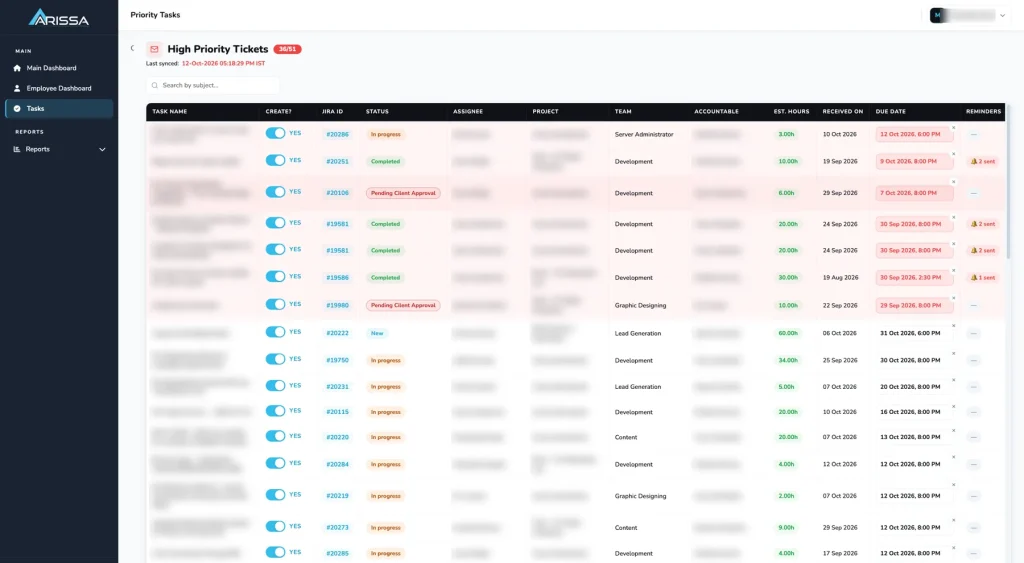
The Priority Tool pulls tickets automatically from Gmail on a scheduled basis, keeping ticket counts and subject lines up to date without manual entry.
Automatic Ticket Sync
Tickets are pulled from Gmail on a scheduled basis, keeping data current without manual work.
Create, Edit & Update Tickets
Manage tickets directly in the platform, including status updates as work progresses.
Ticket Detail View
Review subject, assignee, accountable person, status, and other task-level details for any ticket.
Get a Current Operational Snapshot
Management needs a quick way to understand what’s happening across the business without digging through individual reports.
The High Priority Report gives an operational overview of current inbox, lead, and ticket activity—including ticket totals broken down by assignee, accountable person, and team.
Inbox & Lead Counts
See current inbox volume and total leads, kept up to date through the scheduled sync.
Tickets by Assignee & Accountable Person
See how ticket volume breaks down across the people responsible for the work.
Team-Level Comparison
Compare ticket totals across teams to see where workload is concentrated.
Track What’s Still Open and What Needs Follow-Up
Knowing what’s still in progress and what’s waiting on a client is critical to keeping work moving.
The Open Tickets Report shows open tickets per employee across a custom date range, along with tickets pending client approval and daily activity counts.
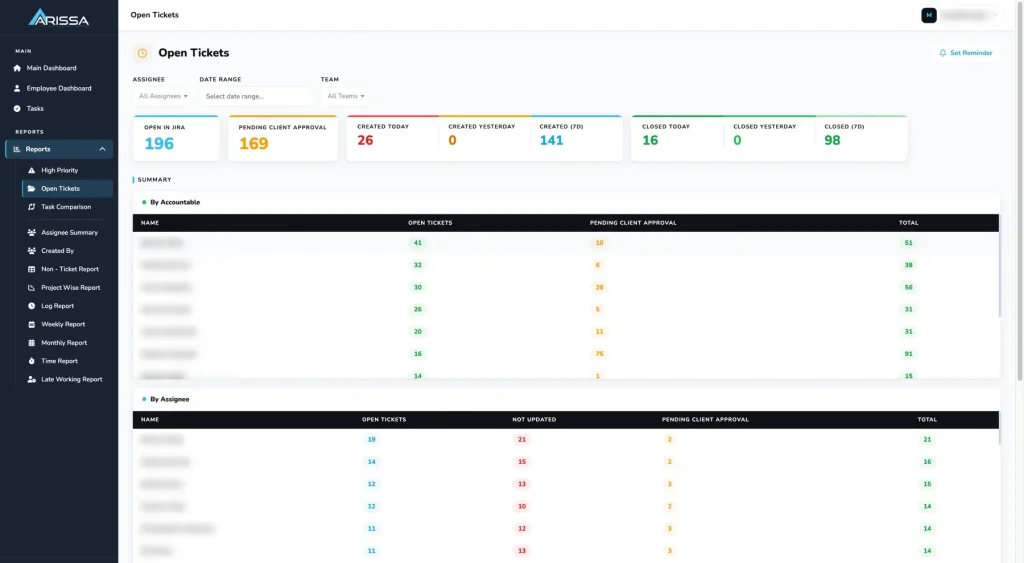
Open Tickets by Employee
Choose a custom date range to see the current open-ticket workload per person.
Pending Client Approval
Identify tickets waiting on client follow-up.
Daily Activity
See tickets created and closed today and yesterday for a quick read on daily movement.
Compare Estimated Effort to Actual Time Spent
Estimating task effort is only useful if you can check it against what actually happened.
The Task Comparison Report shows, for each assignee, total tickets, actual hours logged, estimated hours assigned, and the difference between the two—helping refine future estimates.
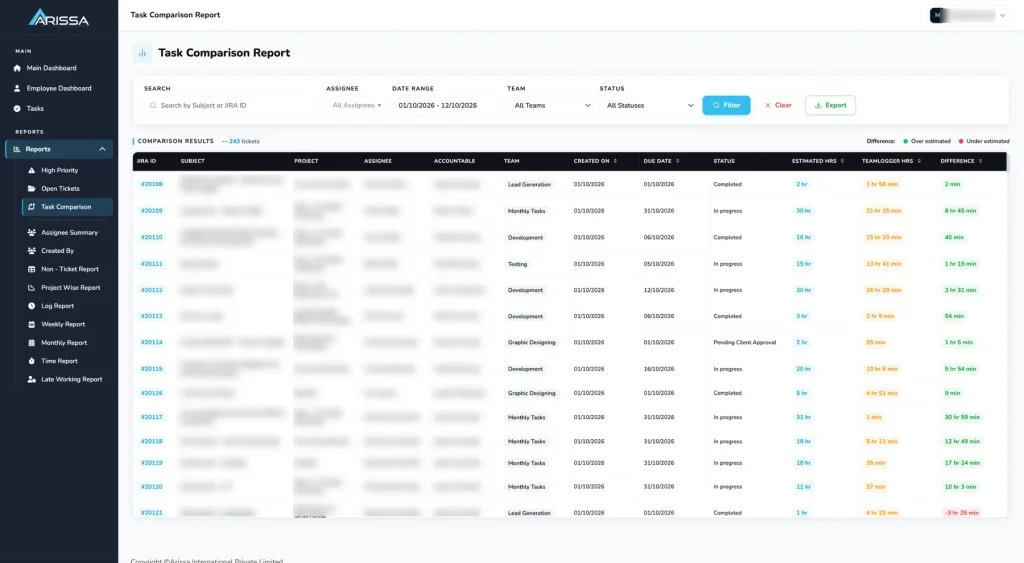
Actual vs. Estimated Hours
See where logged time ran over or under the original estimate by the assignee.
Better Future Planning
Use these patterns to improve how future tasks are estimated.
See how this could work for your team.
Understand Activity at the Individual and Team Level
Different reports give visibility at different levels—from a single employee’s daily hours to how time is spent across an entire project.
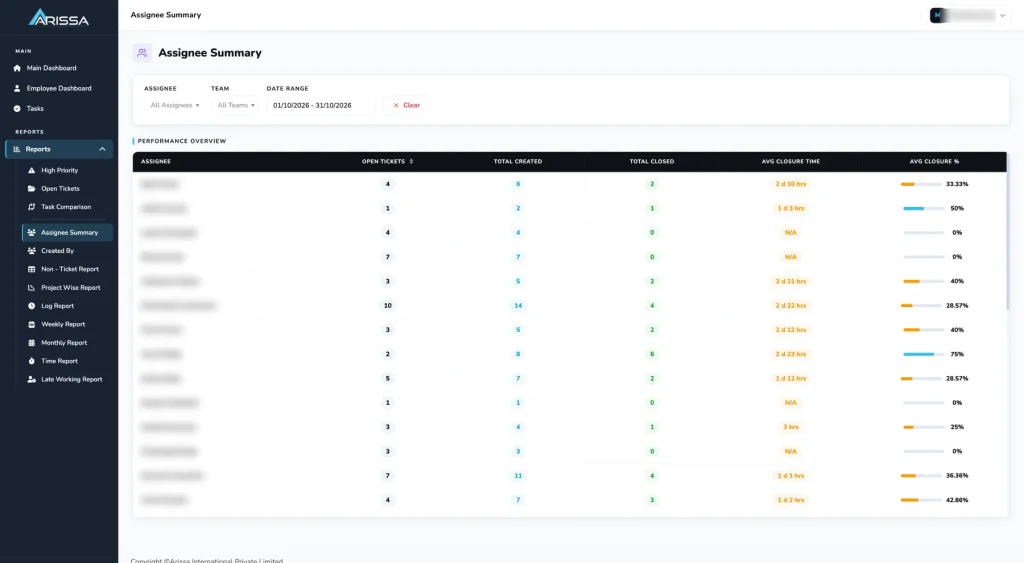
Assignee Summary
Open tickets, total created, total closed, average closure time, and closure percentage per employee—useful during individual performance or workload reviews.
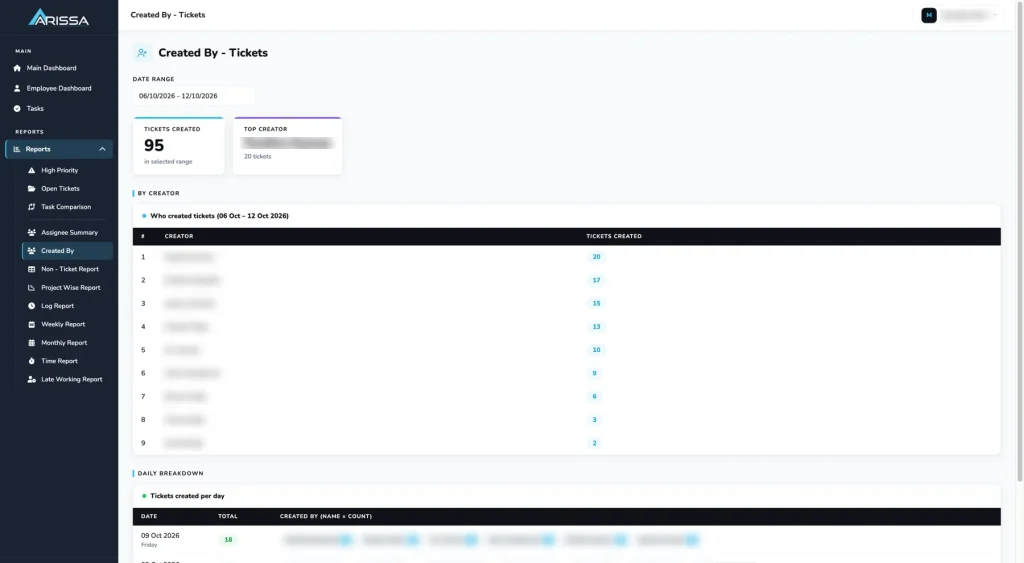
Created By Report
See who is creating tickets, broken down by day, month, or a custom date range.
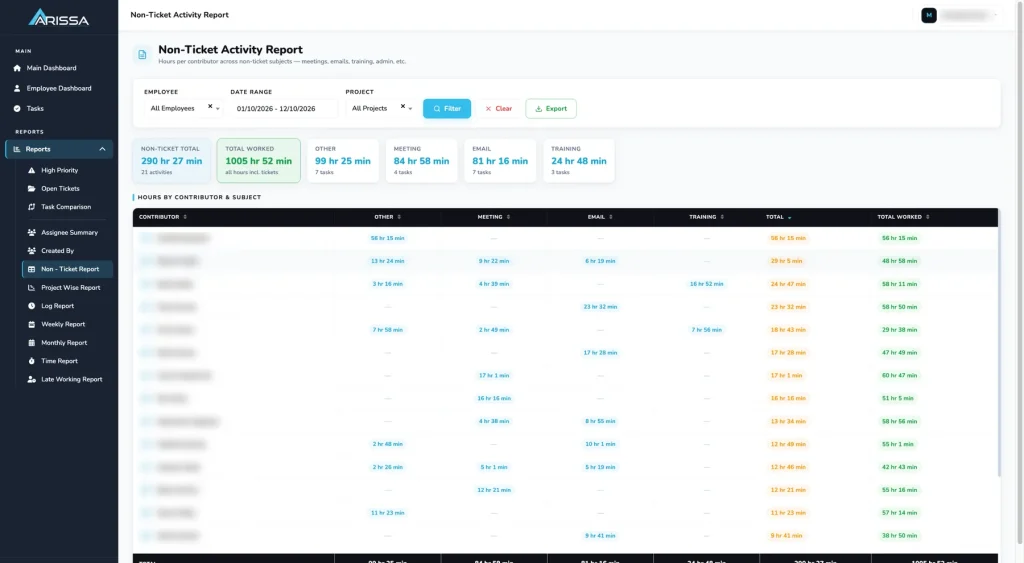
Non-Ticket Report
See hours logged that aren’t tied to a specific ticket, helping account for work happening outside formal tickets and flag entries that may need review.
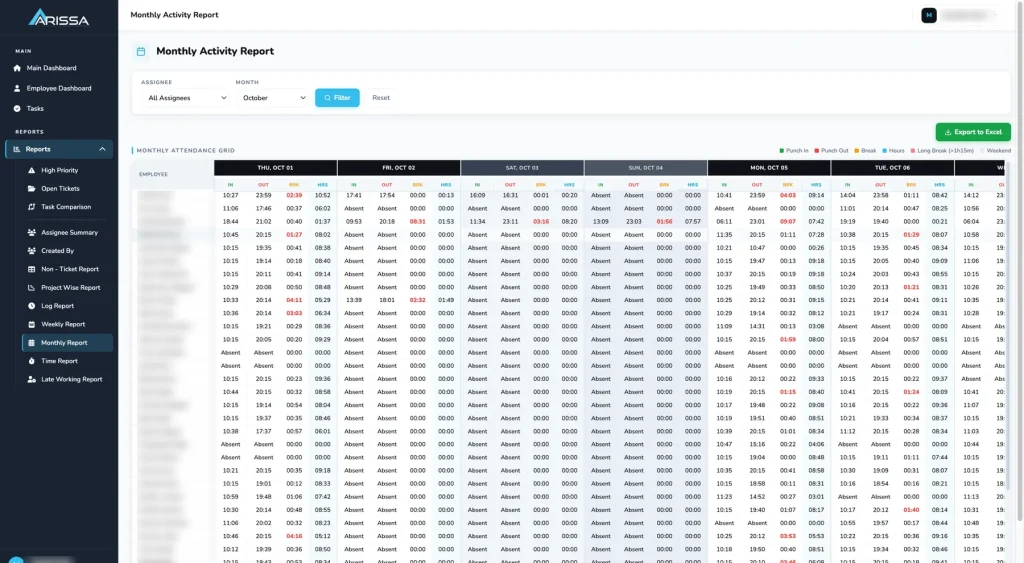
Log, Weekly, Monthly & Time Reports
Detailed punch-in/punch-out data at the daily, weekly, and monthly levels, giving a clear picture of attendance and hours worked.
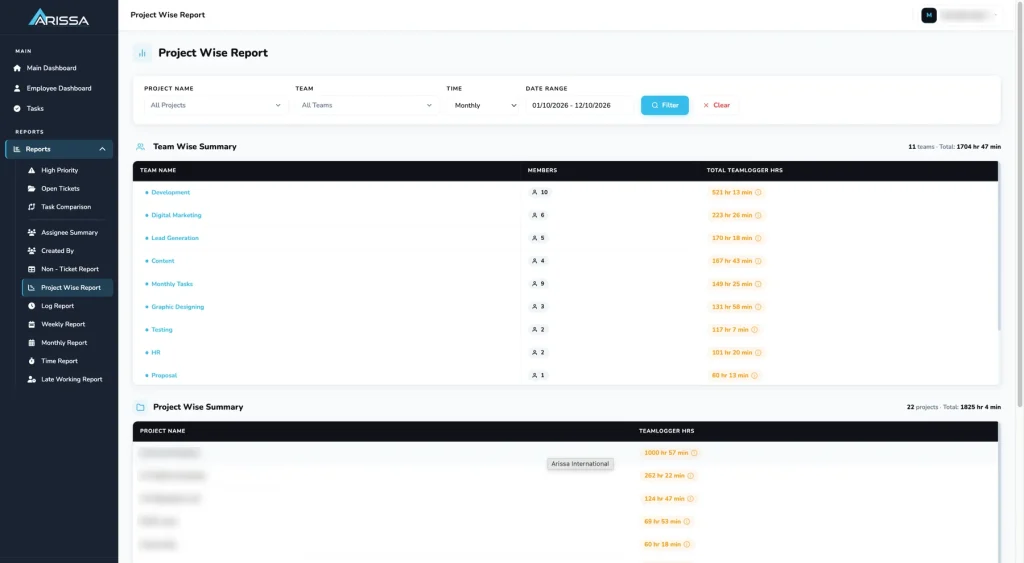
Project-Wise Report
See how hours are distributed across projects, and compare projects to see where team capacity is currently concentrated.
How the Priority Tool Fits Into a Day’s Work
Start with the dashboard to check the current employee workload.
Check Tasks for new and active tickets.
Review Open Tickets for anything needing attention or client follow-up.
Use Task Comparison to check estimated effort against actual hours logged.
Review the Assignee Summary for employee-level ticket activity.
Check Log, Weekly, Monthly, and Time Reports for working-hour information.
Use the Project Wise Report to see where team time is being spent.
From Scattered Systems to One Operational View
- Ticket information updated and checked manually
- Workload visibility limited to individual check-ins
- Estimated and actual effort tracked separately
- Attendance and working hours tracked apart from tickets
- Project effort difficult to see across the team
- Reporting requires pulling from multiple sources
- Tickets synced automatically from Gmail on a schedule
- Workload visible by employee, team, and month
- Estimated vs. actual hours compared directly
- Time tracking and ticket activity in one platform
- Project-level reporting shows where time is spent
- Operational reporting available from one dashboard
Built for Teams Managing Active Ticket-Based Work
Operations Teams
Track ticket volume, workload, and daily activity from one dashboard.
Team Leads & Managers
Compare workload and ticket activity across employees and teams.
Project-Based Teams
See how time is being spent across active projects.
Bring Workload, Tickets & Time Into One Place
Give your team a clearer view of workload, ticket activity, and time — all from one platform.
Let’s build a system around the way your team operates.
Frequently Asked Questions
What is Arissa’s Priority Tool?
It’s a platform that brings together ticket management, employee workload visibility, and time tracking, giving teams a single place to manage day-to-day operational work.
Does it track tickets automatically?
Yes. Tickets are pulled from Gmail on a scheduled basis, keeping ticket counts and details current without manual entry.
Can I see how much work is assigned to each employee?
Yes. The dashboard shows weekly and monthly task hours per employee, with the ability to compare workload across the team.
Can I compare estimated effort to actual hours worked?
Yes. The Task Comparison Report shows actual hours logged against original estimates for each assignee.
Does it track employee working hours?
Yes. Punch In/Punch Out data is tracked and summarized through daily, weekly, and monthly reports.
Can I see how time is being spent across projects?
Yes. The Project Wise Report shows hours logged per project, so teams can compare where capacity is being used.
Can I track which tickets are still open or waiting on a client?
Yes. The Open Tickets Report shows open tickets by employee and flags tickets pending client approval.